
Over the past year, the Big Six Canadian banks have returned 53%, 1.6 times the 32% return for the S&P/TSX Composite Index.1 The Big Six now trade at about 15 times expected earnings, well above the 10 to 12 times investors paid through most of the past quarter century.2 We see four reasons the higher price tag is likely to persist: stronger capital, lighter-touch regulation, a less cyclical loan book, and broader foreign demand. Together, these factors put a firmer floor under the shares.
Why the Market Is Paying More for Canadian Banks
The Big Six trade at 15.2 times expected fiscal 2027 earnings, on a market cap weighted average basis, far above their 10-year average of 10.9 times.2,3 They now trade at a slight discount with the broader S&P/TSX Composite Total Return Index, a striking change from the 28% discount they historically carried.3 This is not being driven by one or two names: every Big Six bank sits well above its own 10-year average, led by Royal Bank at 16.1x, National Bank at 15.0x, and TD at 15.6x, with Scotiabank the relative laggard at 13.8x.2
Big Six Forward P/E — Current vs. 10-Year Average
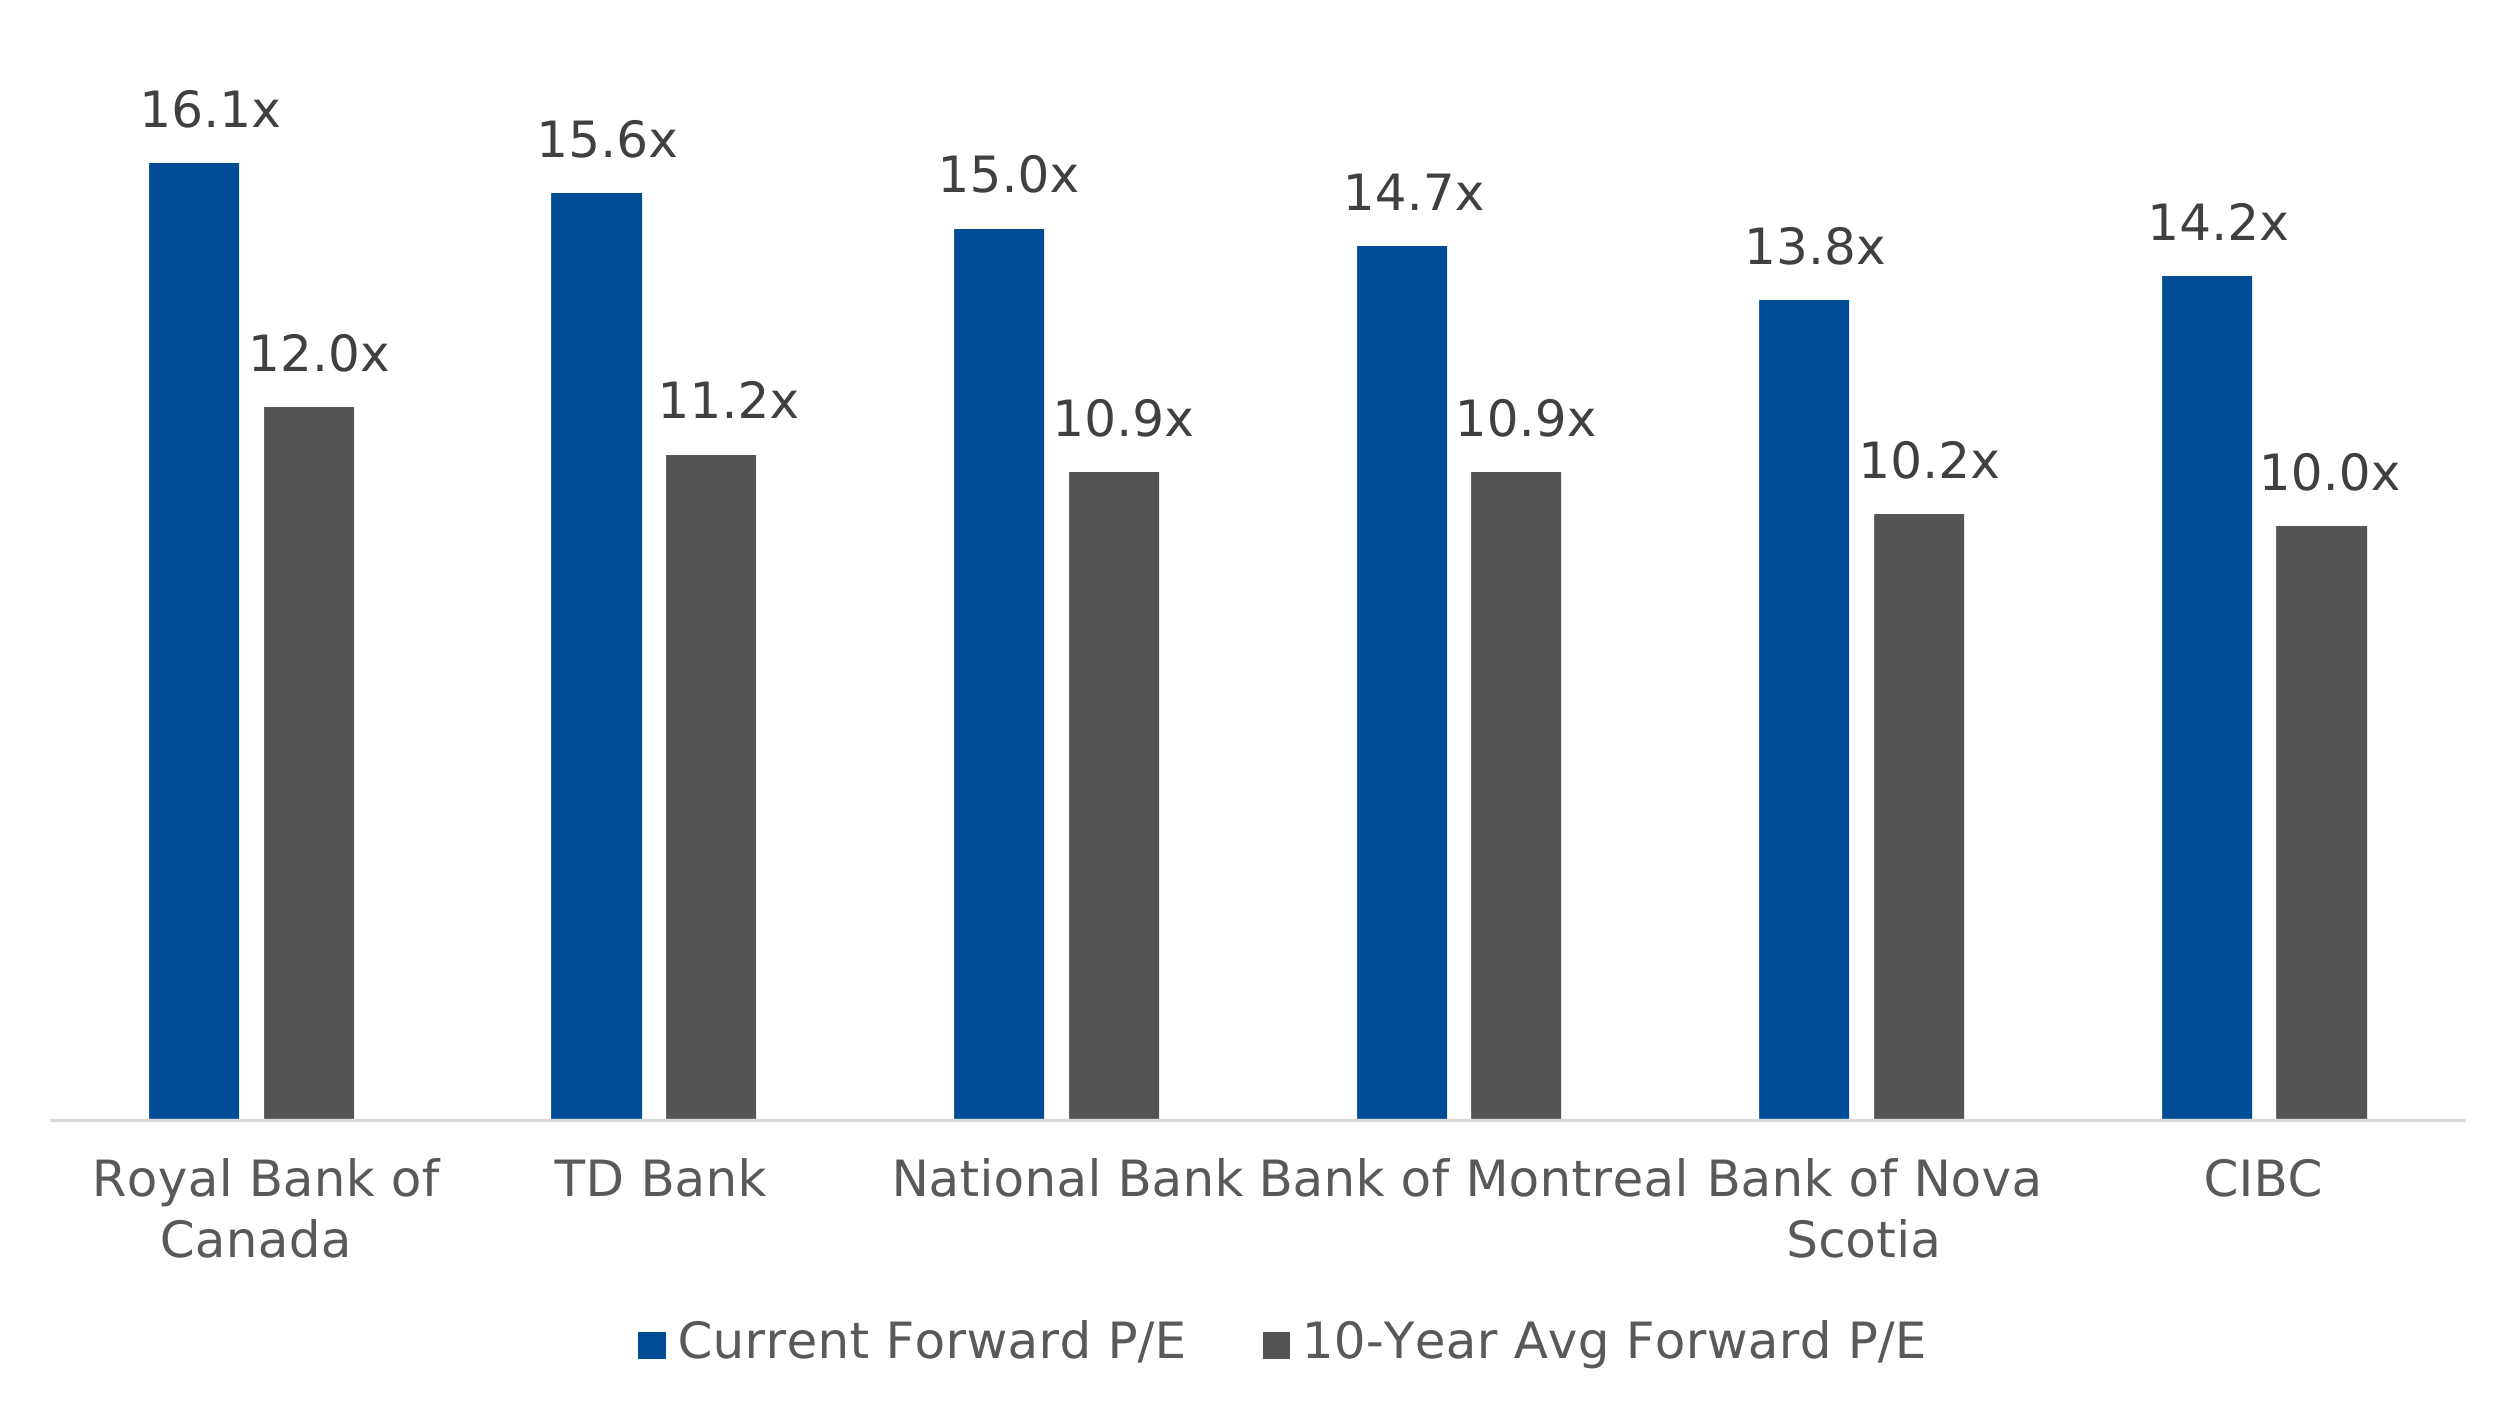
Source: Bloomberg, Aug 27, 2026. P/E on F2027 consensus EPS.
Stronger Earnings and Capital Support the Premium
Results are backing up the higher price. Every large bank beat expectations in the third quarter of fiscal 2026. Adjusted earnings per share rose 21% from a year earlier, and core operating profit was also up double digit.4 The growth came from multiple segments: double-digit gains in capital markets and wealth management fees, supported by steady lending income. This was a genuinely diversified beat rather than one line item carrying the quarter. Most banks also delivered strong operating leverage. Capital is the other half of the story. Core capital (CET1) across the Big Six sits between 13.0% and 14.0%, comfortably above the 11.0% regulators require, and the banks continue to generate more capital every quarter.4,5 That surplus is flowing back to shareholders through buybacks and rising dividends. Importantly, the banks are no longer pursuing expensive U.S. acquisitions that dilute earnings power. Recent deals have been smaller, domestic, and better received by investors.Ottawa Is Easing the Rules
On June 19, 2026, Canada’s banking regulator, OSFI, cut the Domestic Stability Buffer, the extra capital cushion banks must hold, to 3.0% from 3.5%, its first change since 2023. It also lowered the top of the range from 4% to 3%, signalling it is comfortable letting banks put more capital to work. The amount freed up is large: roughly $74 billion of surplus capital, enough to support about $673 billion of additional lending.5 Banks have three ways to use this capital: (1) lend into the federal government’s C$280 billion infrastructure and nation-building push across defence, housing, and AI; (2) return more cash to shareholders through buybacks and dividends; or (3) pursue M&A. In the past, National Bank’s acquisition of Canadian Western Bank and RBC’s acquisition of HSBC Canada have shown that industry consolidation can be well received by Canadian regulators. The shift goes well beyond one decision. Prime Minister Mark Carney’s government has made financial deregulation part of its economic agenda, and OSFI Superintendent Peter Routledge has publicly urged banks to “support hardworking entrepreneurs” and take on more risk. OSFI may revisit the buffer again in December 2026, while the narrower range limits how far it can tighten in the future. That removes an overhang that long kept Canadian banks cheaper than their U.S. peers.A Less Cyclical Business Than Investors Remember
The strongest argument for a permanently higher price is that these banks are far less exposed to the economic cycle than the ones investors learned to fear in the 1990s. Each downturn over the past 25 years has produced smaller loan losses than the one before it. Bank lending has also shifted more toward loans backed by an asset. Unsecured consumer borrowing, such as credit cards and lines of credit, is now only about 10% of domestic loans.6 TD Cowen estimates that even if losses on those unsecured loans rose to 2.7% from a somewhat-stressed 1.8% today, total loan losses for the group would edge up only to about 0.55% of loans from 0.42%, which is manageable, and nothing like the earnings shock downturns once caused.6 Mortgages are well protected too: borrowers are high quality, loan sizes are conservative relative to home values, and Canadian policy simply cannot tolerate a housing collapse when real estate is 15% of GDP, supports 1.2 million jobs and makes up a quarter of national wealth.6 Capital markets and wealth management compound this effect of dampening earnings volatility. When markets turn volatile, trading and advisory revenue tend to rise, serving as a natural offset just as loan losses climb. Two decades ago, that cushion barely existed.A New Buyer: Foreign Investors
Price also depends on who is buying, and the buyer base has changed. Foreign institutions owned 19.3% of the large Canadian banks in May 2026, the highest in roughly 25 years of data, up from 17.7% a year earlier and only about 4% in the early 2000s.3 Royal Bank has the most foreign ownership at 22.5%, but the gap with its peers has narrowed as foreign buying spreads across the group rather than concentrating in one name.3 Steady inflows like these can hold valuations above historical norms for years.Large Canadian Banks’ Average Foreign Institutional
Ownership Over Time
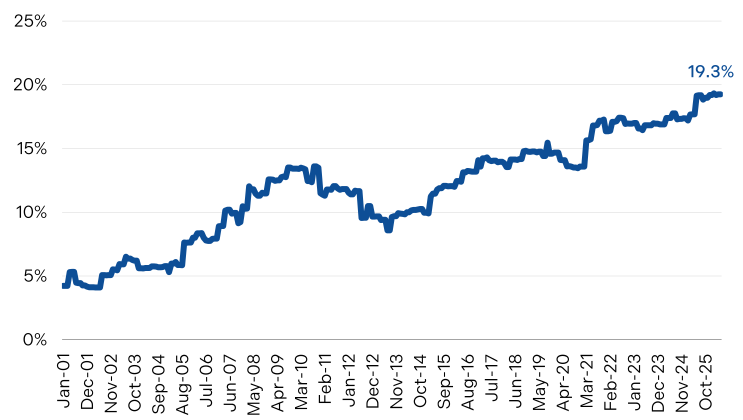
Source: Scotiabank Global Banking and Markets, “Why Higher P/E Multiples for the Cdn Banks Are Here to Stay,” June 16, 2026.
Outlook: A Higher Floor, Not Just a Higher Multiple
We don’t expect the past year to repeat. The Big Six are up 53% over the last 12 months, as of August 27, 2026, beating large U.S. banks and Canadian life insurers.7 From here, we expect returns to come mainly from earnings growth, dividends, and buybacks rather than a further rise in the multiple. The bigger point is the floor, not the ceiling. A group earning more than 15% on shareholders’ equity, growing profits faster than banks almost anywhere else, holding surplus capital, taking less credit risk, and attracting record foreign ownership does not belong at 11 times earnings. We think the market has it right: a mid-teens multiple is the new normal, not a cycle peak.Brompton’s Approach
At Brompton, we have decades of experience investing in financials. Split Corp. Class A shares offer investors the potential for enhanced returns on a portfolio of stocks compared with owning those stocks directly. Brompton Split Banc Corp. (SBC) and Life & Banc Split Corp. (LBS) invest in Canada’s six largest banks, offering enhanced capital appreciation potential and monthly cash distributions. Investors can also gain exposure through Brompton North American Financials Dividend ETF (BFIN) is an actively managed, diversified portfolio of North American financial services companies that includes the large Canadian banks, with monthly distributions and capital appreciation potential. Across these funds, we use an actively managed call writing strategy to earn option premiums and reduce return volatility.1 LSEG Datastream, as of August 27, 2026. Reflects the average 1-year total return for BMO, BNS, CM, NA, RY, and TD compared to the S&P/TSX Composite Index.
2 Bloomberg, August 27, 2026. P/E on F2027 consensus EPS.
3 Scotiabank Global Equity Research, “Why Higher P/E Multiples for the Cdn Banks Are Here to Stay,” June 16, 2026.
4 Company Q2 2026 filings.
5 Office of the Superintendent of Financial Institutions, “OSFI lowers Domestic Stability Buffer to 3.0% so Canada’s largest banks can deploy more capital”, June 19, 2026.
6 TD Cowen Global Research, “Q2/26 Canadian Banks Review – Are the Banks Really that Cyclical?”, June 1, 2026.
7 Bloomberg, as of August 11, 2026.
This report is for information purposes only and does not constitute an offer to sell or a solicitation to buy the securities referred to herein. The opinions contained in this report are solely those of Brompton Funds Limited (“BFL”) and are subject to change without notice. BFL makes every effort to ensure that the information has been derived from sources believed to be reliable and accurate. However, BFL assumes no responsibility for any losses or damages, whether direct or indirect which arise from the use of this information. BFL is under no obligation to update the information contained herein. The information should not be regarded as a substitute for the exercise of your own judgment. Please read the annual information form or prospectus, as applicable, before investing.
Commissions, trailing commissions, management fees and expenses all may be associated with exchange-traded fund investments. Please read the prospectus before investing. Exchange-traded funds are not guaranteed, their values change frequently and past performance may not be repeated.
You will usually pay brokerage fees to your dealer if you purchase or sell shares of the investment funds on the Toronto Stock Exchange or other alternative Canadian trading system (an “exchange”). If the shares are purchased or sold on an exchange, investors may pay more than the current net asset value when buying shares of the investment fund and may receive less than the current net asset value when selling them.
There are ongoing fees and expenses with owning shares of an investment fund. An investment fund must prepare disclosure documents that contain key information about the fund. You can find more detailed information about the fund in the public filings available at www.sedarplus.ca. Investment funds are not guaranteed, their values change frequently and past performance may not be repeated.
Information contained in this document was published at a specific point in time. Upon publication, it is believed to be accurate and reliable, however, we cannot guarantee that it is complete or current at all times. Certain statements contained in this document constitute forward-looking information within the meaning of Canadian securities laws. Forward-looking information may relate to matters disclosed in this document and to other matters identified in public filings relating to the funds, to the future outlook of the funds and anticipated events or results and may include statements regarding the future financial performance of the funds. In some cases, forward-looking information can be identified by terms such as “may”, “will”, “should”, “expect”, “plan”, “anticipate”, “believe”, “intend”, “estimate”, “predict”, “potential”, “continue” or other similar expressions concerning matters that are not historical facts. Actual results may vary from such forward-looking information. Investors should not place undue reliance on forward-looking statements. These forward-looking statements are made as of the date hereof and we assume no obligation to update or revise them to reflect new events or circumstances.