
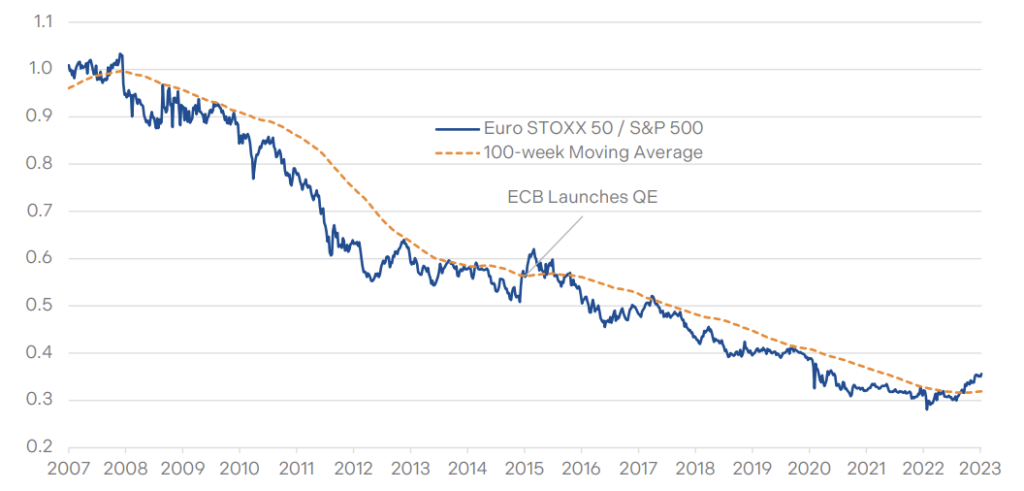
European equity markets have strongly outperformed the U.S. over the past three months in both U.S. dollar and local currency terms. The magnitude of the recent outperformance is unprecedented in the last 15 years, with the Euro STOXX 50 versus S&P 500 materially breaking above its 100-week moving average for the first time since the Great Financial Crisis, except for a brief period in first half of 2015 when the European Central Bank (ECB) launched Quantitative Easing in January (Chart 1). The 100-week moving average is a trend indicator, and the break above this trendline could be an indication that Europe’s structural underperformance has come to an end. We believe several factors have led to Europe’s recent outperformance and should continue to drive this trend.
Chart 1: Europe’s Outperformance vs. U.S. Since GFC
Valuations look more attractive in Europe
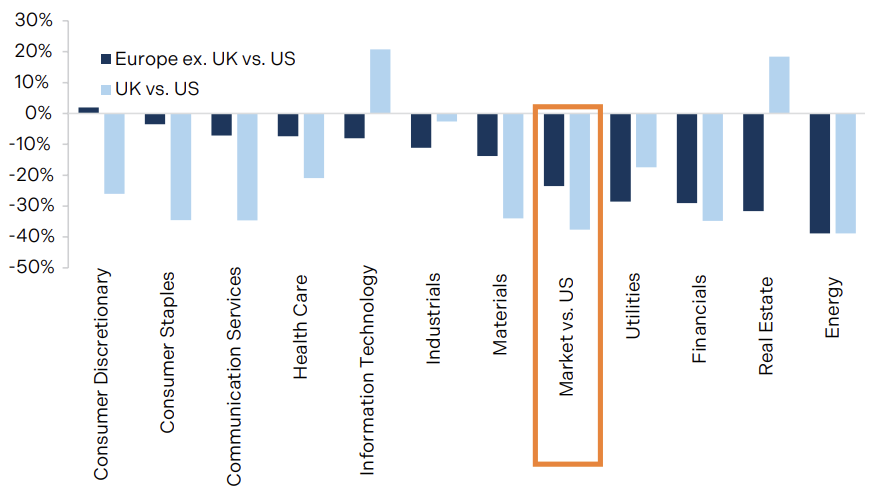
Despite recent outperformance, Europe is still trading at a steep discount compared to its U.S. peers (Chart 2). With the STOXX 600 trading around 13x the 12-month forward price-to-earnings (P/E) and the S&P 500 trading around 18x, the discount remains close to levels during the Great Financial Crisis and 2 standard deviations below its 15-year average. On a sector level, most European GICS sectors are trading at discounts to their U.S. counterparts on a forward P/E basis1 (Chart 3). On a country level, the U.K.—where its FTSE 100 was one of the best performing indices among developed markets in 2022—is trading at a discount to the rest of Europe.
Chart 2: Europe Valuation Discount to the U.S.
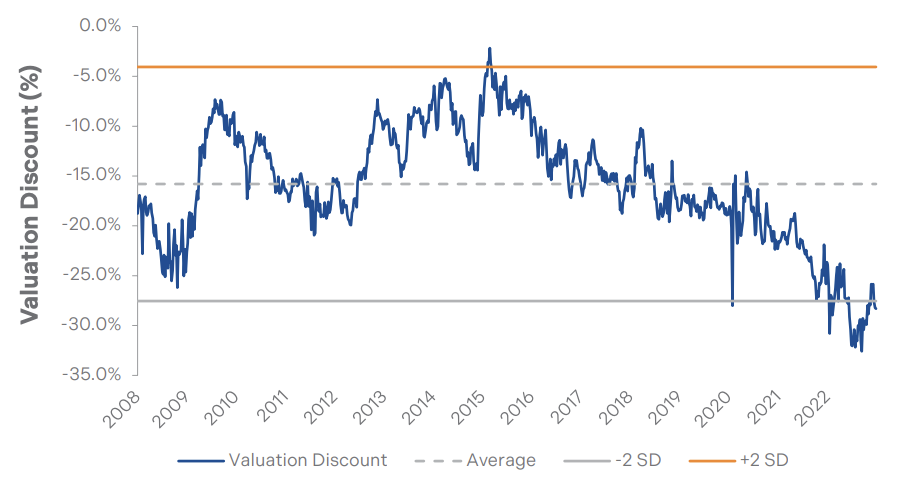
Chart 3: European Sector Valuation Premium (Discount) to U.S.
The macro backdrops have favored Europe, while several headwinds have abated
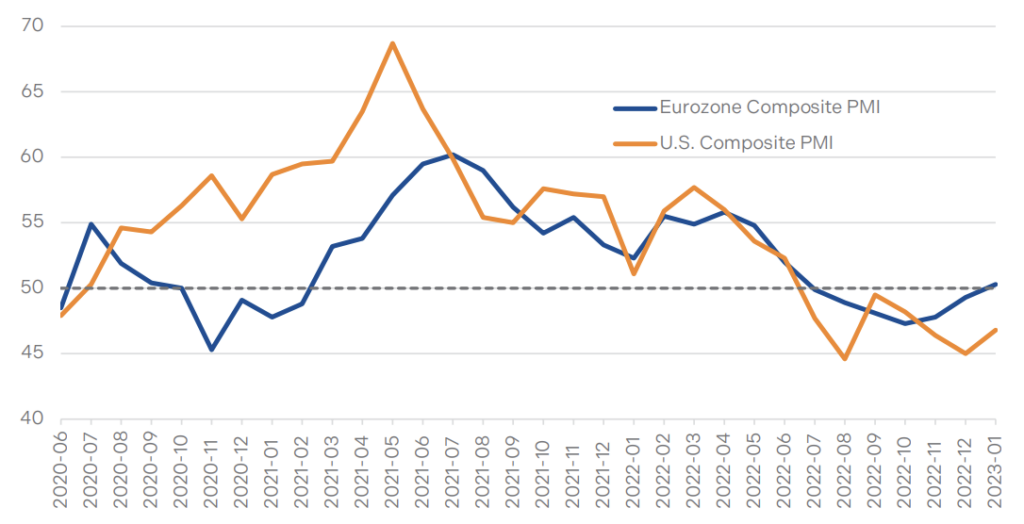
A leading indicator such as the Euro Area Composite Purchasing Manager’s Index (PMI) has rebounded over the past 3 consecutive months and is now in expansionary territory since bottoming in October 2022. The same macro readings are disappointing in the U.S. (Chart 4). Headline inflation continues to weaken in Europe, thanks to a collapse of natural gas prices. We believe the trend of falling energy costs and headline inflation should persist in the first half of this year on the back of a hawkish ECB, falling wholesale energy prices, and further government support (e.g. energy subsidies in Netherlands and Germany, as well as food VAT reduction in Spain). Even though inflation may have peaked and central banks like the U.S. Federal Reserve have slowed the pace of monetary tightening, policy rates will likely remain at elevated levels for a longer period, as inflationary pressures linger. This suggests a new market regime unfolding post-Covid that interest rates will remain at relatively higher levels compared to the last decade. In this vein, we believe that value stocks should outperform growth, which bodes well for Europe. This is because Europe’s sector weights are more skewed to value. We believe that sectors such as Financials, Energy, and Healthcare should have a better chance to shine.
Chart 4: Europe’s PMI Continues to Rebound
Earlier-than-expected China reopening also helped the recent outperformance in Europe
Europe’s economy and revenues have higher exposure to China than the S&P 500. A quick recovery in China’s domestic consumption and outbound travel should continue to support this thesis. In particular, German equities tend to outperform other European markets when China outperforms its emerging market peers2. Many companies with significant revenue exposure to China have already demonstrated robust share performance and better-than expected earnings outlook, such as automakers, luxury goods, and mining.
European companies enjoy higher scores on various ESG metrics than other global regions
Investors love ESG, and Europe is the global leader of sustainability. Europe dominates ESG-related assets under management in terms of both new fund launches and annual net inflow. Fiscal and political forces also emphasize sustainability and green investments. Initiatives like “REPowerEU” will accelerate the energy transition progress and meet EU’s ambitious targets of renewable energy deployment (e.g. 480 GW of wind power capacities by 2030). With all these developments in mind, we believe ESG dedicated funds should continue to flow into Europe.
Europe experienced significant outflows from ETFs and mutual funds during 2022, registering the longest consecutive period of negative flow in the past 20 years3. While cumulative equity fund flow remains negative, we see that recent fund flow into European equity turned positive for the first time this year since the RussiaUkraine conflict3. This suggests that investors’ sentiment towards Europe is at an early stage of improvement. We believe as the geopolitical turbulence cools down and fundamental backdrops recover, it is reasonable to argue that the worst in Europe may be behind us.
Brompton’s Approach
Brompton European Dividend Growth ETF (EDGF) focuses on large European companies that grow their dividends. They tend to be leaders in their respective segments. Their leadership positions allow them to remain resilient in times of uncertainty and their operational scale drives strong economics.
1 Goldman Sachs, Global Equity Views, Why Europe’s outperformance has further to go.
2 Morgan Stanley, European Equity Strategy, What’s Driving Europe’s Record Performance?
3 EPFR https://epfr.com/insights/global-navigator/europe-equity-funds-latest-to-catch-a-lift-europe-fund-flows-allocations-bond-china-energy-indiabrazil/.This document is for information purposes only and does not constitute an offer to sell or a solicitation to buy the securities referred to herein. The opinions contained in this report are solely those of Brompton Funds Limited (“BFL”) and are subject to change without notice. BFL makes every effort to ensure that the information has been derived from sources believed to be reliable and accurate. However, BFL assumes no responsibility for any losses or damages, whether direct or indirect which arise from the use of this information. BFL is under no obligation to update the information contained herein. The information should not be regarded as a substitute for the exercise of your own judgment. Please read the prospectus before investing.
Commissions, trailing commissions, management fees and expenses all may be associated with exchange-traded fund investments. Please read the prospectus before investing. Exchange-traded funds are not guaranteed, their values change frequently and past performance may not be repeated.
Certain statements contained in this document constitute forward-looking information within the meaning of Canadian securities laws. Forward-looking information may relate to matters disclosed in this document and to other matters identified in public filings relating to the fund, to the future outlook of the funds and anticipated events or results and may include statements regarding the future financial performance of the funds. In some cases, forwardlooking information can be identified by terms such as “may”, “will”, “should”, “expect”, “plan”, “anticipate”, “believe”, “intend”, “estimate”, “predict”, “potential”, “continue” or other similar expressions concerning matters that are not historical facts. Actual results may vary from such forward-looking information. Investors should not place undue reliance on forward-looking statements. These forward-looking statements are made as of the date hereof and we assume no obligation to update or revise them to reflect new events or circumstances