
Rapid rate increases in 2022 led to substantial price declines broadly across fixed-income asset classes including U.S. preferred shares. The Manager believes the current yield and price level of U.S. preferred shares offer an opportunity for investors to lock-in an attractive level of income with long-term capital appreciation potential.
The Federal Reserve continued to hike the fed funds rate with a 50 basis points (bps) increase on December 15, 2022. The current target range is up to 4.25-4.50% and the Fed is expected to raise the overnight rate by 0.25% in February, an indication that the Fed may be pulling back on aggressive hikes as signs emerge that inflation may be easing. It also may be worth noting that based on market expectations for peak fed funds rate in 2023, it appears that most of the rate hikes may be behind us. The Bank of Canada raised its policy interest rate by 50 bps in December, and the target rate in Canada is now at 4.25%. The spread between U.S. preferred share yields and the risk-free rate is used for valuation of preferred shares. A wider spread indicates that the market has priced in higher credit risk, reflecting macroeconomic uncertainty and the potential for a recession. The current spread between the 5-year U.S. Government Benchmark Yield and U.S. Preferred Index1 has increased more than 115% compared to the beginning of the year (see chart below).
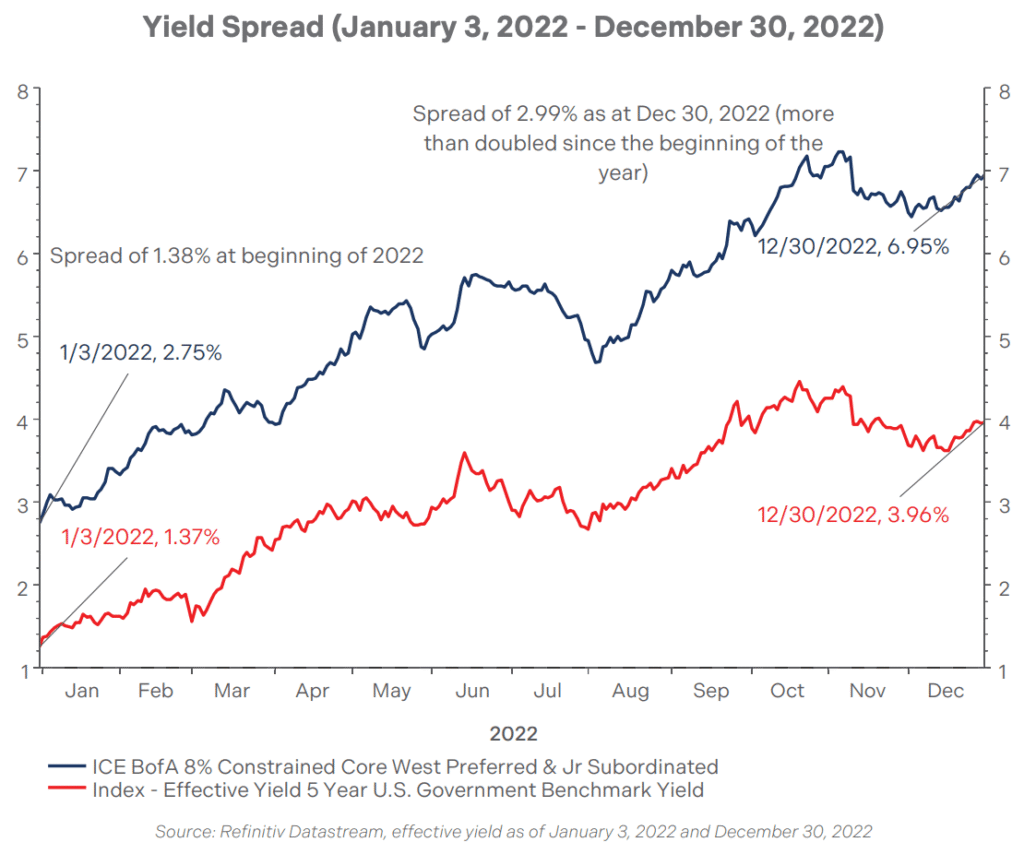
Markets appear to be pricing in the risk of a recession in 2023 which could potentially lead to higher default risk for borrowers. Lower credit quality borrowers such as high-yield bond issuers have a greater risk of default compared to investment grade issuers due to their weaker balance sheets and greater sensitivity to rising interest costs and weakening economic conditions.
Credit quality in the U.S. preferred market is primarily investment grade. Furthermore, while some U.S. preferreds are rated below investment grade, nearly all U.S. preferred issuers have investment grade senior debt (their preferreds are rated below investment grade due to subordination to senior debt of the issuer). The main U.S. preferred issuers are large, well known financial services companies such as banks, insurance companies, utilities and energy companies with solid balance sheets and reliable cash flow that will allow them to cope with different market conditions.
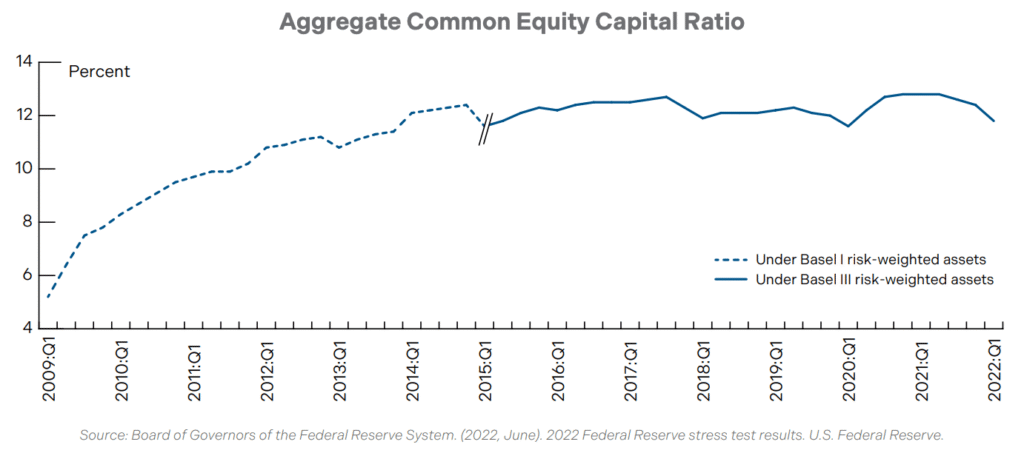
Banks remain very well capitalized and highly regulated, and most are “asset-sensitive” which means earnings should increase with higher interest rates. In June, the 2022 Federal Reserve Stress Test was conducted, and the results showed that large U.S. financial services companies have sufficient capital to absorb more than U.S.$600 billion in losses and continue lending to households and businesses under stressful conditions. In large part, this is due to the substantial buildup of capital since the 2007–09 financial crisis.2
Insurance companies also benefit from higher interest rates, which allow insurers to invest policyholder premiums and maturing investments into higher-yielding securities. Higher interest rates also mean that insurance liabilities are discounted at a higher rate, which reduces the present value of the liability payments on their balance sheet, improving their capital positions.
Pipeline and utility companies’ earnings should continue to benefit from higher energy usage, strong energy prices, and changes in the energy landscape. These sectors have significant barriers to entry with stable revenue streams even during difficult economic conditions.
The seven Fed Funds rate increases announced by the US Federal Reserve in 2022 were designed to slow the U.S. economy and ease the impact of a generational-high level of inflation. What if rate increases push the U.S. economy into recession?
The Manager’s belief is that if the U.S. economy avoids recession, there is the possibility that Fed Funds rate increases continue, possibly at a slower pace; but this would likely be countered by tightening credit spreads for U.S. preferred shares as investors regain confidence. On the other hand, if there is a recession, U.S. preferred credit spreads may widen putting downward pressure on prices, but 5-10 year government interest rates should also decline in anticipation of future Fed fund rate cuts in this scenario, providing offsetting support for U.S. preferred prices. In either a recession or an expansion scenario, we expect reasonably good support for U.S. preferred share prices.
Currently the U.S. preferred market’s effective yield is 7.0%, which has more than doubled from 2.8% only oneyear ago3. From a historical performance perspective, the price return of U.S. preferred shares represents a minor portion of the total return; the real determining factor for long term growth is the income.
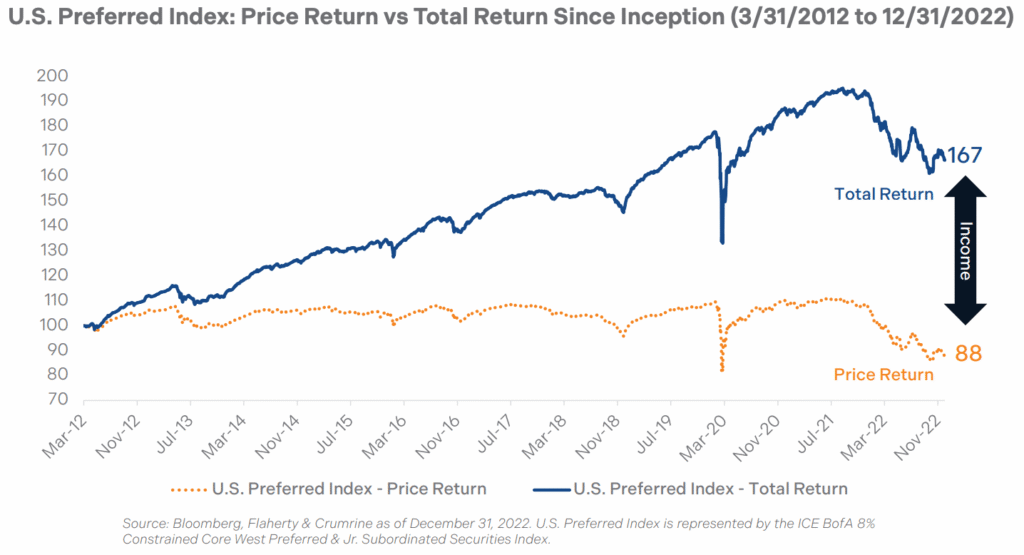
The current yield level allows new investors to earn high income that can absorb at least a portion of losses from any potential short-term downside scenarios, while locking in an attractive yield that is the basis for strong long-term returns.
BPRF offers actively managed exposure to the U.S. preferred asset class, is risk-rated Low to Medium, and provides an attractive 5.7% p.a. distribution yield as at December 30, 2022. For investors with a higher risk appetite, Brompton offers BEPR – Brompton Flaherty & Crumrine Enhanced Investment Grade Preferred ETF. This fund has a target leverage level of approximately 30% of assets, which provides an enhanced level of distribution yield and potential for capital appreciation. BEPR currently has a distribution rate of 9.3%, as of December 30, 2022.
Performance as of December 31, 20224:

Brompton’s Approach
U.S. preferreds are liquid, have high credit quality on average, and offer yields that are higher than Canadian preferreds and more than double the yields on U.S. Investment Grade bonds. Brompton Flaherty & Crumrine Investment Grade Preferred ETF (BPRF, BPRF.U) and Brompton Flaherty & Crumrine Enhanced Investment Grade Preferred ETF (BEPR, BEPR.U) offer ways to invest in the U.S. preferred share market with the benefit of active management by the longest tenured U.S. preferred share specialist, Flaherty & Crumrine Incorporated.
1 Source: U.S. Preferred Index is represented by ICE BofA 8% Constrained Core West Preferred & Jr. Subordinated Securities Index.
2 Source: 2022 Federal Reserve stress test results. U.S. Federal Reserve. The Federal Reserve’s evaluation of a bank’s common equity capital was initially measured using a tier 1 common capital ratio but now is evaluated using a common equity tier 1 capital ratio, which was introduced into the regulatory capital framework with the implementation of Basel III to replace Basel I. Not all of the banks included in the 2022 stress test reported data for all periods since 2009. https://www.federalreserve.gov/publications/files/2022-dfast-results-20220623.pdf
3 Source: Refinitiv Datastream, effective yield (discounted semi-annually) of ICE BofA 8% Constrained Core West Preferred & Jr. Subordinated Securities Index as of December 31, 2021 and December 31, 2022.
4 Returns are for the periods ended December 31, 2022 and are unaudited. The table shows the ETFs’ compound returns for each period indicated. Past performance does not necessarily indicate how the ETF will perform in the future. The information shown is based on Net Asset Value per unit and assumes that distributions made by the ETF on its units in the period shown were reinvested at Net Asset Value per unit in additional units of the ETF. Distribution rate based on December 31, 2022 closing market price. Source: Thomson Reuters.
This document is for information purposes only and does not constitute an offer to sell or a solicitation to buy the securities referred to herein. The opinions contained in this report are solely those of Brompton Funds Limited (“BFL”) and are subject to change without notice. BFL makes every effort to ensure that the information has been derived from sources believed to be reliable and accurate. However, BFL assumes no responsibility for any losses or damages, whether direct or indirect which arise from the use of this information. BFL is under no obligation to update the information contained herein. The information should not be regarded as a substitute for the exercise of your own judgment. Please read the prospectus before investing. Commissions, trailing commissions, management fees and expenses all may be associated with exchange-traded fund investments. Please read the prospectus before investing. The indicated rates of return are the historical annual compounded total returns including changes in unit value and reinvestment of all distributions and do not take into account sales, redemption, distribution or optional charges or income taxes payable by any securityholder that would have reduced returns. Exchange-traded funds are not guaranteed, their values change frequently and past performance may not be repeated. Certain statements contained in this document constitute forward-looking information within the meaning of Canadian securities laws. Forward-looking information may relate to matters disclosed in this document and to other matters identified in public filings relating to the Funds, to the future outlook of the Funds and anticipated events or results and may include statements regarding the future financial performance of the Funds. In some cases, forward-looking information can be identified by terms such as “may”, “will”, “should”, “expect”, “plan”, “anticipate”, “believe”, “intend”, “estimate”, “predict”, “potential”, “continue” or other similar expressions concerning matters that are not historical facts. Actual results may vary from such forward-looking information. Investors should not place undue reliance on forward-looking statements. These forward-looking statements are made as of the date hereof and we assume no obligation to update or revise them to reflect new events or circumstances.