
Funds in focus: Brompton Global Infrastructure ETF (BGIE); Brompton Utilities & Infrastructure HighPay ETF (PAYI); Power & Infrastructure Split Corp. (PWI)
The Canada Investment Summit came at an interesting moment for investors. As Canada looks to attract capital into energy, infrastructure, critical minerals and other major projects, markets are also beginning to place a higher value on the physical assets that underpin economic growth. It is a shift that sits at the heart of what we call the HALO trade.
CPP Investments and PSP Investments co-hosted the Canadian Investment Summit, while they and Ontario Teachers’ have also signaled an intention to increase investment in Canada.
For years, investors were willing to pay very high prices for asset-light software companies. The appeal was simple: software could grow quickly, earn high margins and scale without requiring huge amounts of physical investment.
Artificial Intelligence (“AI”) is starting to challenge that story.
It is becoming easier and cheaper to replicate many software products, which means some of these software companies may have less pricing power and face more competition than investors previously expected. If their future growth and profits look less certain, investors are naturally less willing to pay high valuations for them.
At the same time, the opposite is happening in parts of the physical economy.
Companies that already own large, difficult-to-replace infrastructure assets – such as refineries, electric transmission networks, fleets of aircrafts, pipelines etc. – are becoming increasingly valuable.
There are two reasons for this. First, demand for many of them are increasing. AI is accelerating the need for data centres, electricity generation, transmission infrastructure and other physical assets. Geopolitical uncertainty is also pushing countries to bring manufacturing closer to home and invest more heavily in energy infrastructure, as they look to strengthen supply chains and improve energy security. Second, building new capacity has become much harder and more expensive. Interest rates are higher, labour and material costs have increased and permitting can take years.
That creates an important imbalance: demand can rise quickly, but supply cannot.
If a company already owns an asset that everyone suddenly needs, and competitors cannot easily build another one, that company gains pricing power. It can earn higher returns on its existing assets and generate more cash without having to recreate the infrastructure from scratch. Investors are then willing to place a higher value on that company.
This is the basic idea behind the HALO trade: Heavy Assets, Low Obsolescence. In a world where digital products can be disrupted quickly, there is growing value in owning physical assets that are essential, scarce, and difficult to replace.
The Hyperscaler Capex Boom
What makes the HALO trade particularly interesting today is the scale of the capital investment now required to build the AI economy.
AI may be software, but the infrastructure required to produce it is anything but asset-light. The largest technology companies are rapidly increasing spending on data centres, computing infrastructure and the enormous amounts of electricity needed to power them. US hyperscalers are on pace to spend roughly $1.15 trillion in capex in 2027 alone, compared with about $600 billion across their entire history prior to 2023 combined1.
Amazon + Microsoft + Alphabet + Meta + SpaceX capex forecasts
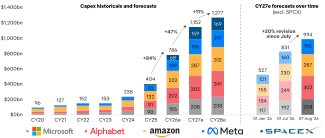
Source: Morgan Stanley, August 9, 2026. Data as at July 8, 2026, “e” = consensus estimates.
And that spending does not remain inside the technology sector.
It flows into power generation and transmission, electrical equipment, cooling systems, construction, materials and other parts of the physical economy. In other words, some of the biggest beneficiaries of the AI boom may not be the companies building the software itself, but the companies supplying the physical infrastructure that makes AI possible.
This matters because much of that infrastructure cannot be created quickly. A new transmission line, power plant, pipeline or mine can take years to finance, permit and construct. Higher interest rates, rising labour costs and more expensive materials have also pushed up the cost of building new capacity.
The result is that existing assets become increasingly valuable precisely when demand for them is accelerating. That combination of rising demand and constrained supply is what gives many HALO businesses their unusual pricing power today.
EPS Growth Revisions Now Favour Capital Intensive Companies
12-month fwd EPS growth for Capital Light (GSSTCAPL) and Capital Intensive (GSSTCAPI) baskets
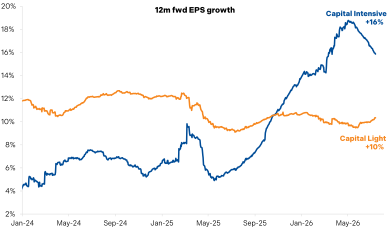
Source: Goldman Sachs, July 7, 2026.
Investing in Companies That Get Paid Now
There is growing concern about whether the enormous sums that technology companies are investing in AI will ultimately generate attractive returns, and how long those returns will take to materialize.
The challenge for investors is that there is still a great deal of uncertainty. It is difficult to know which AI companies will emerge as the long-term winners, how profitable they will become, and when those profits will justify the amount of capital being spent today.
That is why we prefer the “picks and shovels” side of the AI trade.
Technology companies are spending enormous amounts on data centres, power generation and transmission, electrical equipment, cooling systems and other physical infrastructure. Rather than trying to predict which technology company will dominate AI several years from now, we prefer to invest in the companies being paid today to build the infrastructure the AI boom requires.
How To Invest in Infrastructure – BGIE, PWI & PAYI
Investors looking to participate in the HALO trade can choose from one of Brompton’s three infrastructure-focused funds: Brompton Global Infrastructure ETF (BGIE), Power & Infrastructure Split Corp. (PWI), and Brompton Utilities & Infrastructure HighPay ETF (PAYI).
Within BGIE, PWI & PAYI, we’re focused on several key themes inside this capex boom that we see as structural drivers of growth rather than a one-year rotation.
Four areas in particular – Datacentres, Semiconductors, Utilities, and Defence – are expected to account for more than 40% of total global capital spending in 2026, up from just 25% in 20222.
We See Renewables, Transmission, Datacentres and Semiconductors as Structural Growth Areas
GS Capex Tracker by end-market; size of bubble = % sales exposure to end-market
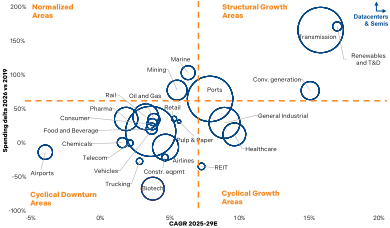
Source: Goldman Sachs, July 7, 2026.
Infrastructure. Companies that own critical, hard-to-replicate networks – grids, power plants, pipelines, transport assets – where the barrier to entry is as much regulatory and physical as it is financial.
Suppliers such as engineering companies and electrical equipment such as transformers, cabling, switchgear that sit at the heart of the broader power build-out as grids are upgraded and expanded to meet AI-driven demand.
Aerospace & Defence. Firms benefiting from highly specialized manufacturing capabilities, multi-decade product cycles, and rising geopolitical demand.
Basic Materials. Businesses controlling the essential inputs that underpin global manufacturing.
With BGIE, PAYI, and PWI, investors have three ways to access infrastructure opportunities driven by the HALO trade, depending on their income needs and growth objectives:
For investors seeking stable monthly income plus growth, BGIE invests in a diversified, actively managed portfolio of global infrastructure companies, which may also include their suppliers of services or equipment. An active covered call writing program is used to generate additional income and reduce overall portfolio volatility.
| Annual compound returns3 | ||||||
|---|---|---|---|---|---|---|
| Fund |
Distribution Yield4 |
YTD | 1-Year | 3-Year | 5-Year |
Since Inception 30-Apr-20 |
| Brompton Global Infrastructure ETF (BGIE) | 6.0% | 10.8% | 15.0% | 20.6% | 12.4% | 13.7% |
For income-focused investors seeking more frequent cash flow, PAYI offers high income with twice monthly distributions by investing primarily in leading utilities and infrastructure companies. Covered call writing and modest leverage is used to enhance income while also providing the opportunity for capital appreciation.
| Fund | Distribution | NAV 31-Aug-26 |
|---|---|---|
| Brompton Utilites & Infrastructure HighPay ETF (PAYI) | $0.16 semi-monthly | $23.63 |
Note: Investment fund regulations restrict the presentation of performance figures until a fund reaches its one-year anniversary.
For growth-focused investors, PWI Class A shares offer leveraged exposure to a globally diversified portfolio of power and infrastructure companies to provide enhanced returns and tax-efficient monthly distributions.
| Annual compound returns3 | ||||||
|---|---|---|---|---|---|---|
| Fund |
Distribution Yield4 |
YTD | 1-Year | 3-Year | 5-Year |
Since Inception 21-May-21 |
| Power & Infrastructure Split Corp. (PWI) | 11.7% | 17.4% | 25.3% | 37.2% | 14.6% | 15.4% |
1 Morgan Stanley, August 9, 2026
2 Goldman Sachs, July 7, 2026
3 Returns are for the periods ended August 31, 2026, and are unaudited. The tables show the compound return on the units of Brompton Global Infrastructure ETF and the Class A shares of Power & Infrastructure Split Corp. for each period indicated. Past performance does not necessarily indicate how the funds will perform in the future. The performance information shown is based on the net asset value per unit or net asset value per Class A Share, as applicable, and assumes that cash distributions made by the funds during the periods shown were reinvested at the net asset value per unit or net asset value per Class A Share in additional units or Class A Shares of the respective fund. Past performance does not necessarily indicate how the funds will perform in the future.
4 Based on August 31, 2026 closing market price. Source: LSEG Workspace. Yield represents an estimate of the annual yield an investor would receive if the most recent monthly distribution remained unchanged for the next 12 months, stated as a percentage of the closing market price of the fund’s share/unit.
This document is for information purposes only and does not constitute an offer to sell or a solicitation to buy the securities referred to herein. The opinions contained in this report are solely those of Brompton Funds Limited (“BFL”) and are subject to change without notice. BFL makes every effort to ensure that the information has been derived from sources believed to be reliable and accurate. However, BFL assumes no responsibility for any losses or damages, whether direct or indirect which arise from the use of this information. BFL is under no obligation to update the information contained herein. The information should not be regarded as a substitute for the exercise of your own judgment. Please read the annual information form or prospectus, as applicable, before investing
Commissions, trailing commissions, management fees and expenses all may be associated with exchange-traded fund investments. Please read the prospectus before investing. The indicated rates of return are the historical annual compounded total returns including changes in unit value and reinvestment of all distributions and does not take into account sales, redemption, distribution or optional charges or income tax payable by any securityholder that would have reduced returns. Exchange-traded funds are not guaranteed, their values change frequently and past performance may not be repeated.
You will usually pay brokerage fees to your dealer if you purchase or sell shares of the investment funds on the Toronto Stock Exchange or other alternative Canadian trading system (an “exchange”). If the shares are purchased or sold on an exchange, investors may pay more than the current net asset value when buying shares of the investment fund and may receive less than the current net asset value when selling them.
There are ongoing fees and expenses with owning shares of an investment fund. An investment fund must prepare disclosure documents that contain key information about the fund. You can find more detailed information about the fund in the public filings available at www.sedarplus.ca. The indicated rates of return are the historical annual compounded toral returns including changes in share value and reinvestment of all distributions and do not take into account certain fees such as redemption costs or income taxes payable by any securityholder that would have reduced returns. Investment funds are not guaranteed, their values change frequently and past performance may not be repeated.
Information contained in this document was published at a specific point in time. Upon publication, it is believed to be accurate and reliable, however, we cannot guarantee that it is complete or current at all times. Certain statements contained in this document constitute forward-looking information within the meaning of Canadian securities laws. Forward-looking information may relate to matters disclosed in this document and to other matters identified in public filings relating to the funds, to the future outlook of the funds and anticipated events or results and may include statements regarding the future financial performance of the funds. In some cases, forward-looking information can be identified by terms such as “may”, “will”, “should”, “expect”, “plan”, “anticipate”, “believe”, “intend”, “estimate”, “predict”, “potential”, “continue” or other similar expressions concerning matters that are not historical facts. Actual results may vary from such forward-looking information. Investors should not place undue reliance on forward-looking statements. These forward-looking statements are made as of the date hereof and we assume no obligation to update or revise them to reflect new events or circumstances.