Free Cash Flow Yield ETFs
Discover why cash is king
Free Cash Flow Yield ETFs
Discover why cash is king
Free Cash Flow Yield maximizes value
Companies with high levels of Free Cash Flow (excess cash) have opportunities to create shareholder value.
Free Cash Flow is the fuel that powers a company’s growth and profitability.


Harness the power of Free Cash Flow Yield
High Free Cash Flow companies have many options to fund profitable growth initiatives with cash, or reward shareholders with cash payouts.
The Cash Flow Kings strategy buys inexpensive companies with high Free Cash Flow. This is a formula used by many investors. Now it’s available to you, in an easy-to-access ETFs.
Strategy Highlights
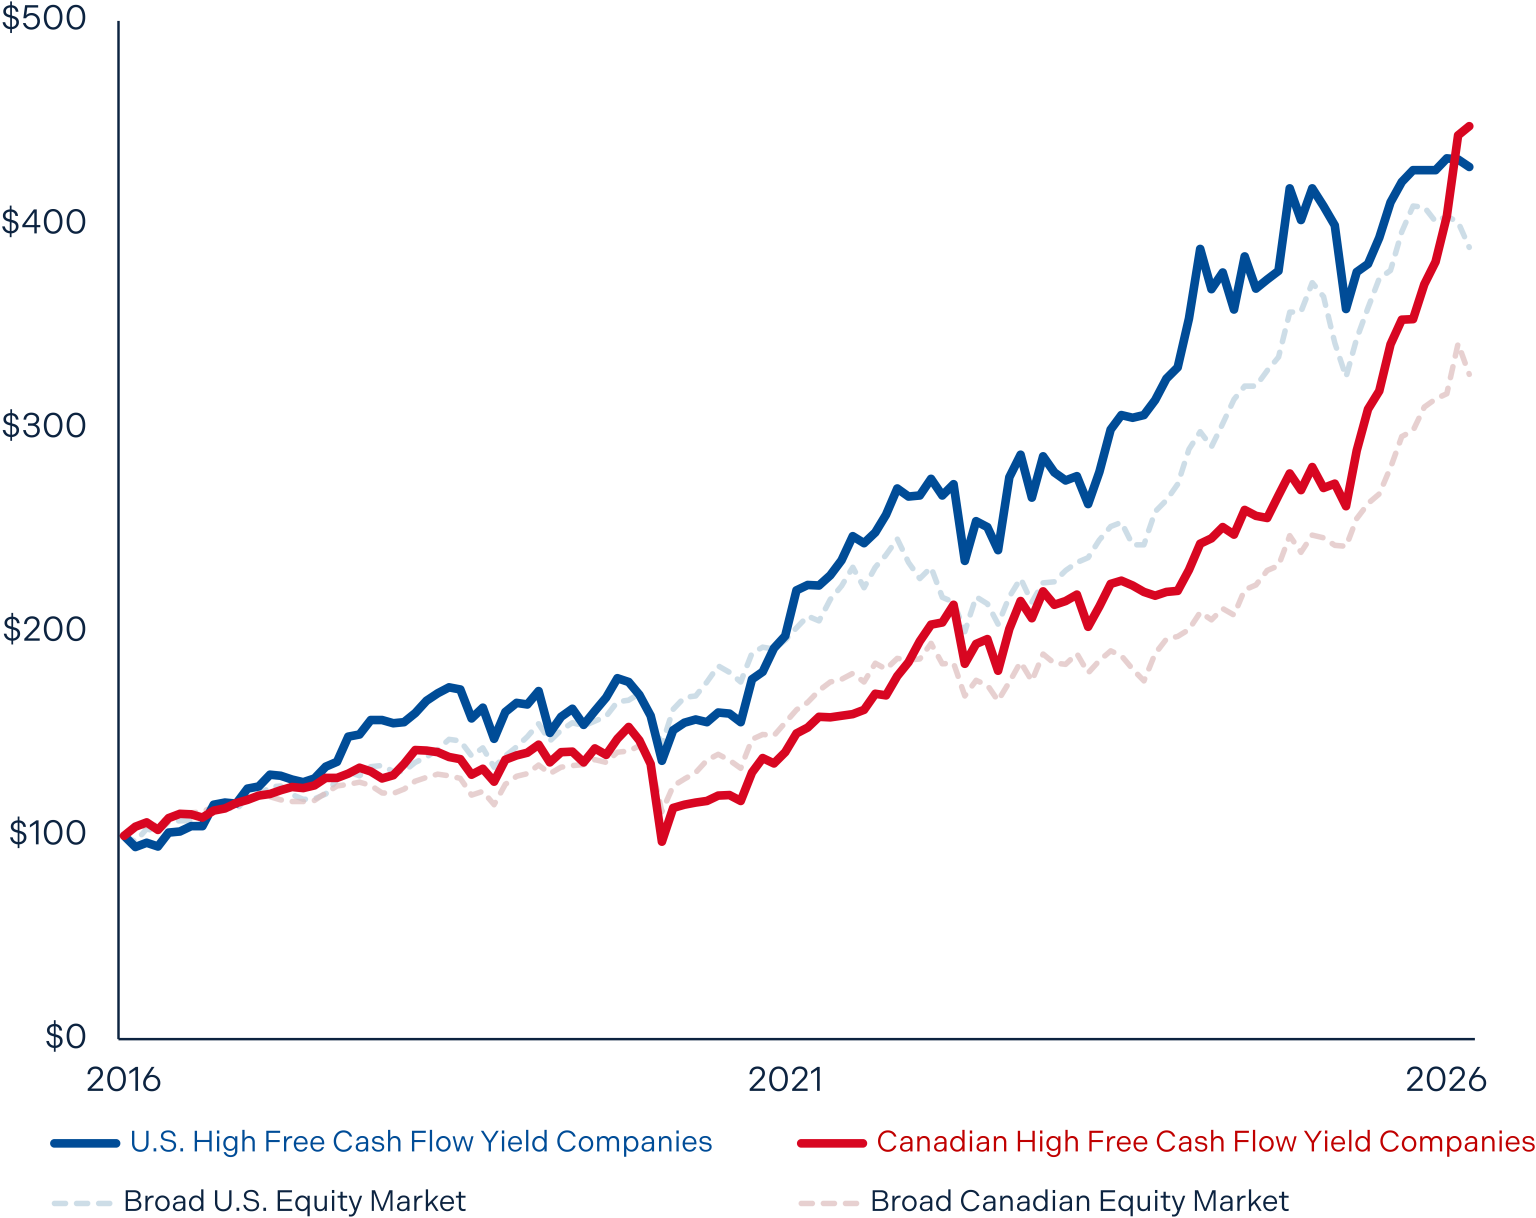
Companies with high free cash flow yields have historically outperformed the broader equity market1
Brompton Index One Canadian Cash Flow Kings Index and Brompton Index One U.S. Cash Flow Kings Index shown versus S&P/TSX Composite Index and S&P 500 Index for the period from March 31, 2016 to March 31, 2026.
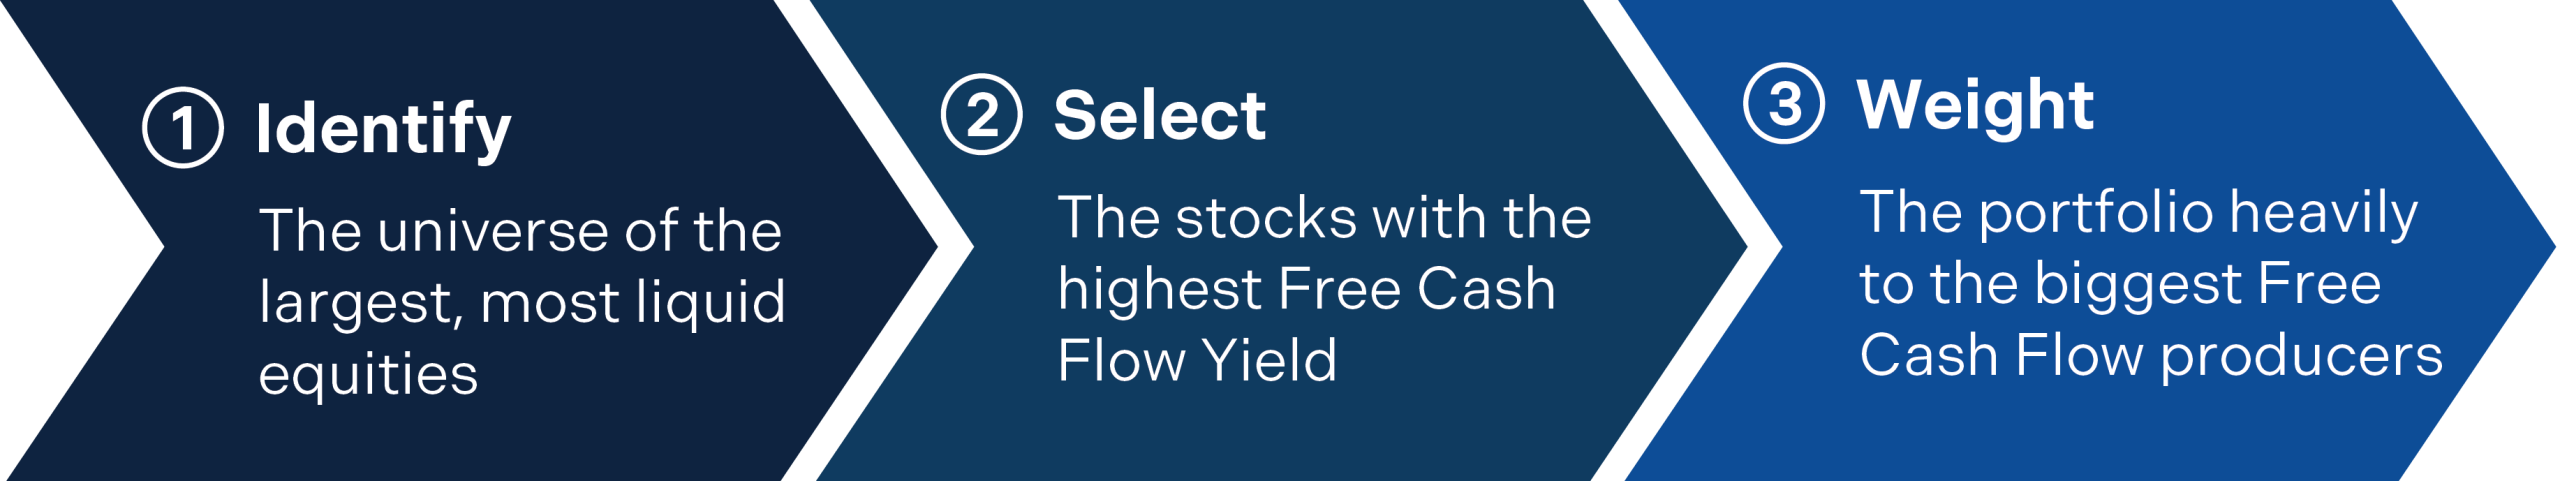
An objective rules-based methodology to select quality high Free Cash Flow yielding companies.

A Better Way to Find Value
Free Cash Flow Yield, unlike traditional P/E ratios, cuts through accounting noise to focus on what truly matters – how much cash a company generates. This approach uncovers high-quality businesses trading at attractive valuations.
Low Management Fees
0.0% management fees2 for Brompton Global Cash Flow Kings ETF (KNGG), 0.45% for Canadian and U.S. Cash Flow Kings ETFs (KNGC & KNGU), and 0.55% for International Cash Flow Kings ETF (KNGX).
Dynamic Sector Allocation
Portfolio rebalanced frequently to focus on the highest free cash flow yielding companies. Canadian and U.S. strategies rebalanced quarterly, Global and International strategies rebalanced semi-annually.
Global Reach. Diversified Strength.
Diversified across Canadian, U.S., and international markets and sectors, with no exposure to Financials, and avoiding overvalued stocks and sectors. Brompton Global Cash Flow Kings ETF (KNGG) is a diversified global portfolio combining Brompton’s three Cash Flow Kings ETFs, giving access to 135 global Free Cash Flow Yield leaders.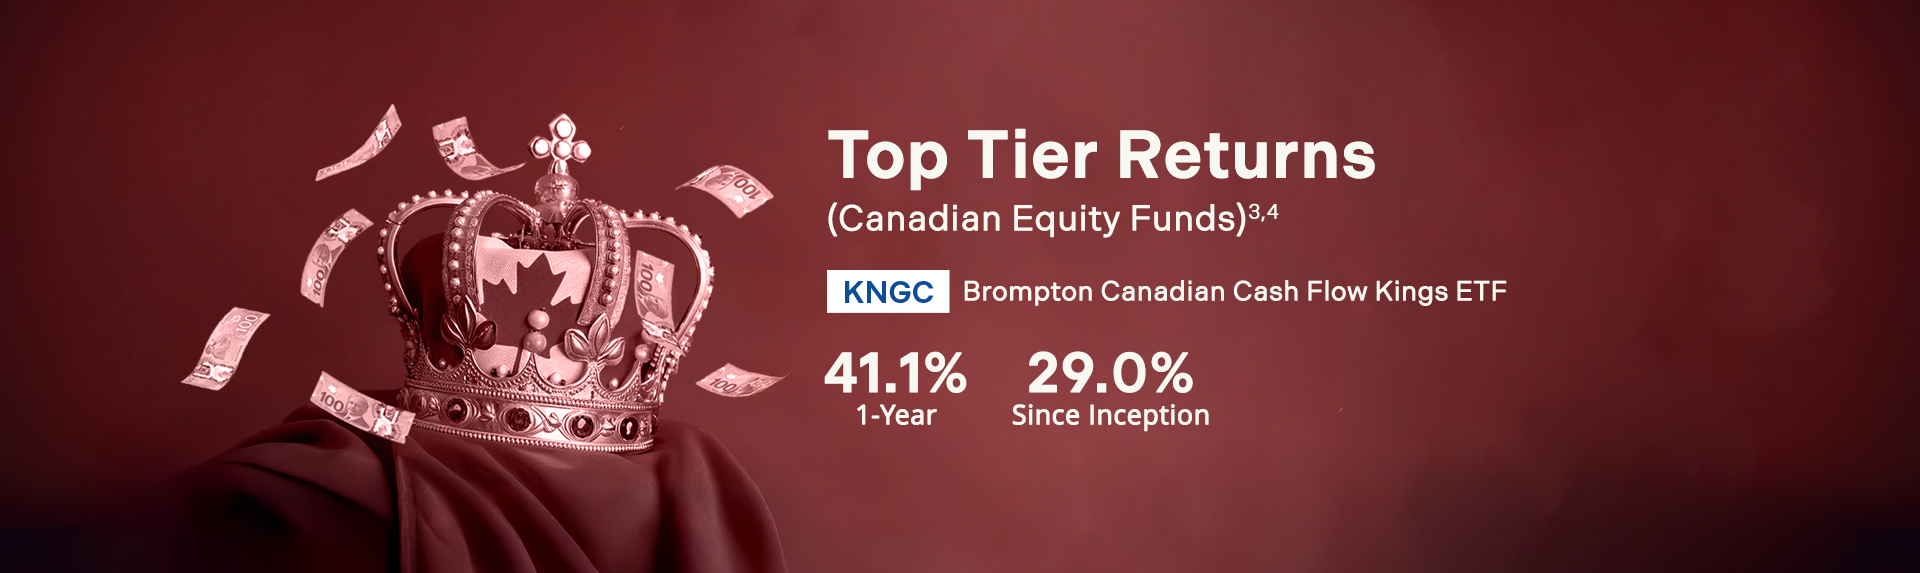
Brompton Cash Flow Kings ETFs
Brompton Global Cash Flow Kings ETF (KNGG)
Brompton Canadian Cash Flow Kings ETF (KNGC)
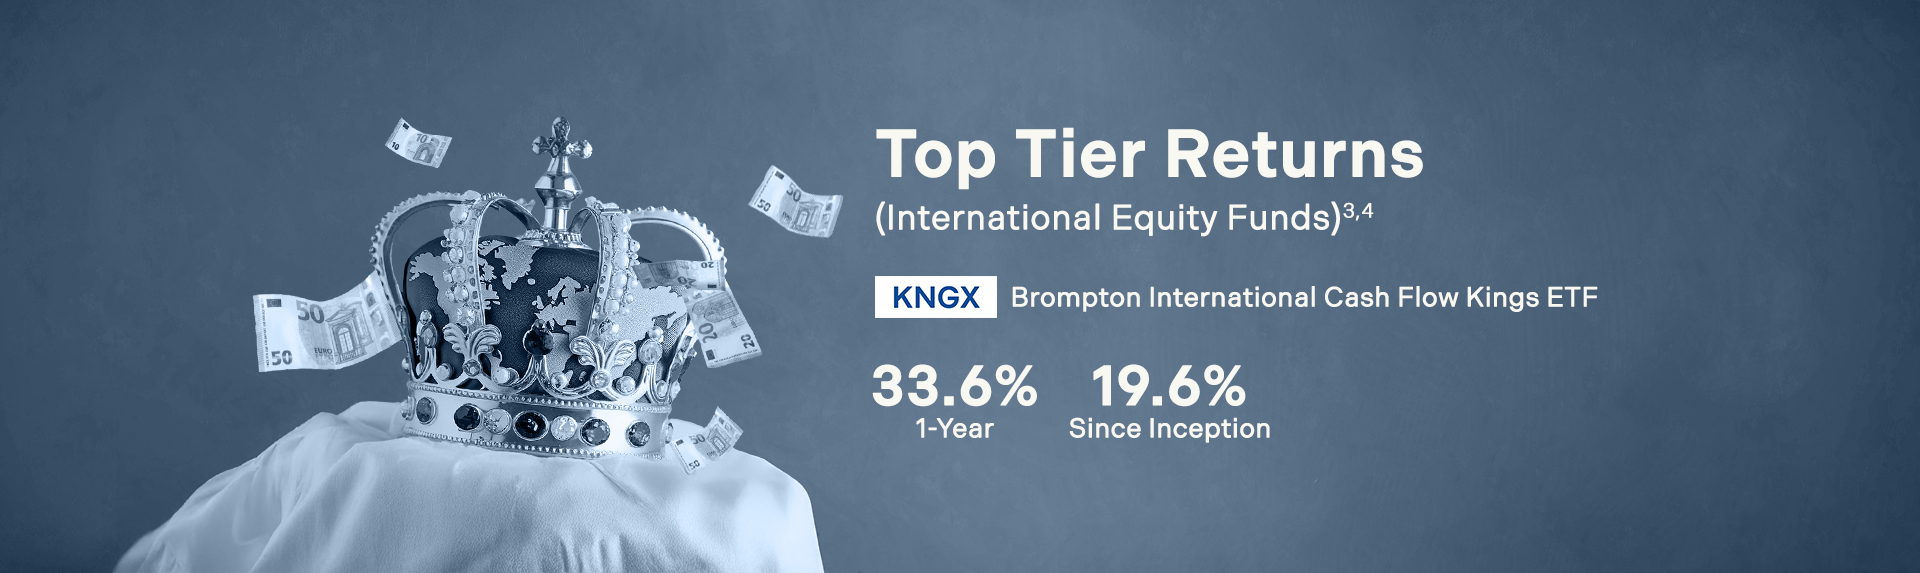
Brompton International Cash Flow Kings ETF (KNGX)
Brompton U.S. Cash Flow Kings ETF (KNGU)
Brompton’s Head of ETFs on Free Cash Flow Yield
Disclosures
1 Source: Index One, Morningstar Direct. Reflects total returns for the period from March 31, 2016 to March 31, 2026. Returns are shown in Canadian dollars. The historical performance of the Brompton Index One Canadian Cash Flow Kings Index shown and the Brompton Index One U.S. Cash Flow Kings Index is hypothetical performance and should not be considered as a tradable portfolio and does not guarantee any future performance of the strategy. Indices are not investment advice and should not be construed as investment advice. The Index relies directly or indirectly on various sources of information to assess the criteria of issuers included in the Index, including information that may be based on assumptions and estimates. Neither the ETFs, the Index Provider, or BFL can offer assurances that the indices’ calculation methodology or sources of information will provide an accurate assessment of included issuers or a correct valuation of securities, nor can they guarantee the availability or timeliness of the production of the applicable index.
2 Subject to fees of the underlying Brompton Cash Flow Kings ETFs
3 Morningstar Direct. Based on total return as of April 30, 2026, KNGC ranked 1st percentile over 1-year with a #3 absolute rank out of out of 599 Canadian Equity funds. KNGX ranked 2nd percentile over 1-year with a #6 absolute rank out of 679 International Equity funds. Past performance is no guarantee of future results. © 2026 Morningstar. All Rights Reserved. The information contained herein: (1) is proprietary to Morningstar and/or its content providers; (2) may not be copied or distributed; and (3) is not warranted to be accurate, complete or timely. Neither Morningstar nor its content providers are responsible for any damages or losses arising from any use of this information.
4 Returns are for the periods ended June 30, 2026 and are unaudited. KNGU and KNGC inception date May 30, 2024. KNGX inception date July 16, 2024. The table shows the ETF’s compound returns for each period indicated. Past performance does not necessarily indicate how the ETF will perform in the future. The information shown is based on Net Asset Value per unit and assumes that distributions made by the ETF on its units in the period shown were reinvested at Net Asset Value per unit in additional units of the ETF.
This document is for information purposes only and does not constitute an offer to sell or a solicitation to buy the securities referred to herein. The opinions contained in this report are solely those of BFL and are subject to change without notice. BFL makes every effort to ensure that the information has been derived from sources believed to be reliable and accurate. However, BFL assumes no responsibility for any losses or damages, whether direct or indirect which arise from the use of this information. BFL is under no obligation to update the information contained herein. The information should not be regarded as a substitute for the exercise of your own judgment. Please read the prospectus before investing.
Commissions, trailing commissions, management fees and expenses all may be associated with exchange-traded fund investments. Please read the prospectus before investing. The indicated rate[s] of return is [are] the historical annual compounded total return[s] including changes in share value and reinvestment of all distributions and does not take into account sales, redemption, distribution or optional charges or income tax payable by any securityholder that would have reduced returns. Exchange-traded funds are not guaranteed, their values change frequently and past performance may not be repeated.
Information contained in this document was published at a specific point in time. Upon publication, it is believed to be accurate and reliable, however, we cannot guarantee that it is complete or current at all times.
Certain statements contained in this document constitute forward-looking information within the meaning of Canadian securities laws. Forward-looking information may relate to matters disclosed in this document and to other matters identified in public filings relating to the ETFs, to the future outlook of the ETFs and anticipated events or results and may include statements regarding the future financial performance of the ETFs. In some cases, forward-looking information can be identified by terms such as “may”, “will”, “should”, “expect”, “plan”, “anticipate”, “believe”, “intend”, “estimate”, “predict”, “potential”, “continue” or other similar expressions concerning matters that are not historical facts. Actual results may vary from such forward-looking information. Investors should not place undue reliance on forward-looking statements. These forward- looking statements are made as of the date hereof and we assume no obligation to update or revise them to reflect new events or circumstances.