FNB européen de croissance de dividendes Brompton
Portefeuille géré activement d'entreprises européennes à forte capitalisation boursière et à dividendes croissants.


FNB européen à dividendes croissants avec revenu mensuel
FNB européen de croissance de dividendes Brompton (EDGF) offre des distributions mensuelles stables et un potentiel d'appréciation du capital grâce à un portefeuille géré activement d'actions de sociétés européennes à forte capitalisation et à dividendes croissants. Ce FNB d'actions mondial utilise un programme actif de vente d'options d'achat couvertes pour générer des revenus supplémentaires et réduire la volatilité globale du portefeuille.
Points saillants de l'investissement
- Portefeuille de haute qualité composé de sociétés européennes à forte capitalisation et à dividendes croissants.
- Revenu mensuel stable et potentiel de croissance
- Stratégie d'achat d'options d'achat couvertes sélectives pour améliorer les revenus du portefeuille et réduire la volatilité
Pourquoi les entreprises européennes à dividendes croissants ?
- Les entreprises européennes ayant une tradition de croissance des dividendes ont surperformé le marché dans son ensemble au fil du temps¹ .
- Brompton estime que les actions européennes sont actuellement évaluées de manière attrayante par rapport aux actions américaines .
- Avantages de la diversification : L’Europe offre aux Canadiens la possibilité de diversifier leurs placements en investissant dans des secteurs boursiers sous-représentés sur le marché canadien¹ .
Renseignements sur le fonds
-
SYMBOLE
-
CUSIP11222M100
-
Parts en circulation(Oct 16, 2026)2,970,052
-
Date de début (couvert en CAD)21 juillet 2017
-
GestionnaireBrompton Funds Limited
-
AdmissibilitéTous les comptes de placement enregistrés (REER, FERR, REEE, CELI, CAF) et non enregistrés
-
Sous-conseillerBrompton Funds Limited
-
Frais de gestion0.75%
-
Style de gestionActif
- DeviseCouverture CAD
- CatégorieAppel couvert sur actions FNB
- StyleRevenus et croissance
- Distribution FrequencyMonthly
Informations connexes


Les investisseurs ont aussi consulté :
Géré par Brompton Funds Limited
Fondée en 2000, Brompton est une société de gestion de fonds d'investissement expérimentée offrant des solutions d'investissement axées sur le revenu et la croissance, notamment des fonds négociés en bourse ( FNB ), Fonds à capital scindé et d'autres fonds d'investissement cotés à la Bourse de Toronto (TSX). Nos fonds sont conçus pour répondre aux besoins de trésorerie des investisseurs et leur offrir des stratégies de diversification à valeur ajoutée. Depuis sa création, Brompton a distribué plus de 3,8 milliards de dollars. Compte tenu de la qualité du service offert, nos fonds sont reconnus pour leurs faibles frais de gestion.

Laura Lau
BASc (avec distinction), CFA, DMS
directeur des placements
Laura Lau possède plus de 25 ans d'expérience dans le domaine des investissements et est directrice des investissements chez Brompton Funds. Mme Lau dirige l'équipe de gestion de portefeuille de Brompton qui supervise les actifs investis principalement dans des mandats de vente d'options d'achat couvertes, tant au niveau mondial que canadien, conçus pour générer des revenus et réduire la volatilité des rendements.

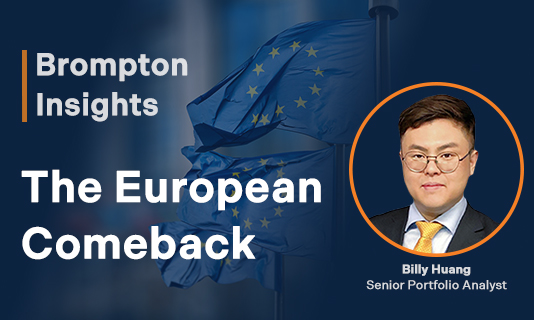
Billy Huang
Analyste principal en investissement
Billy Huang s'est joint à Brompton Funds en 2021 et occupe le poste d'analyste financier senior. Il se spécialise dans la sélection d'actions, notamment dans les secteurs des biens de consommation de base, de la consommation discrétionnaire, des services de communication et des matériaux. Il est également responsable de l'exécution des ordres de bourse.
Summary of Investment Portfolio as at September 30, 2026
Summary of Investment Portfolio as at September 30, 2026
Les 25 principales participations
| % de Valeur liquidative | ||
|---|---|---|
| ASML Holding NV ADR | 6.0% | |
| NVent Électrique PLC | 4.9% | |
| UniCredit SpA | 4.8% | |
| InterContinental Hotels Group PLC ADR | 4.5% | |
| Rolls-Royce Holdings PLC | 4.5% | |
| ABN Amro Bank NV | 4.3% | |
| Shell PLC ADR | 4.3% | |
| Iberdrola, SA | 4.0% | |
| Prysmian SpA | 3.8% | |
| Linde PLC | 3.7% | |
| Allianz SE | 3.7% | |
| Tesco PLC | 3.7% | |
| Industria de Diseno Textil SA | 3.5% | |
| EDP SA | 3.5% | |
| Barclays PLC ADR | 3.5% | |
| Société Générale SA | 3.4% | |
| Roche Holding AG | 3.4% | |
| Anglo American PLC | 3.4% | |
| Assicurazioni Generali SpA | 3.4% | |
| Safran SA | 3.4% | |
| Abbé Ltd. | 3.3% | |
| Ferrovial NV | 3.1% | |
| Espèces | 3.0% | |
| Crédit Agricole SA | 2.9% | |
| Koninklijke KPN NV | 2.5% | |
| Total | 94.5% |

Croissance de 10 000 $ (1)
Performance
Rendements composés annuels (2)(3)
| Fonds | cumul à ce jour | 1 an | 2-Year | 3 ans | 5 ans | 10 ans | Depuis sa création (4) | Depuis sa création (3) | Depuis sa création (5) |
|---|---|---|---|---|---|---|---|---|---|
| FNB européen à dividendes croissants | 1.9% | 3.0% | 13.5% | 6.6% | - | 7.5% |
Rendements d'une année à l'autre (2)
| Fonds | 2025 | 2024 | 2023 | 2022 | 2021 | 2020 | 2019 | 2018 | 2017 (5) |
|---|---|---|---|---|---|---|---|---|---|
| FNB européen de croissance de dividendes Brompton | 20.1% | 12.6% | 11.8% | ( 19.2 %) | 24.4% | 0.5% | 34.8% | ( 11.1 %) | 3.9% |
Tableau de distribution
| Date d'enregistrement | Date de paiement | gains en capital | Dividende admissible | Revenus étrangers non commerciaux | Impôt étranger sur le revenu non commercial payé | Autres revenus | Remboursement du capital | Distribution totale |
|---|---|---|---|---|---|---|---|---|
| sept. 30 , 2026 | oct. 08 , 2026 | * | * | * | * | * | * | 0.07000 |
| août 31 , 2026 | sept. 09 , 2026 | * | * | * | * | * | * | 0.07000 |
| juill. 31 , 2026 | août 11 , 2026 | * | * | * | * | * | * | 0.07000 |
| juin 30 , 2026 | juill. 09 , 2026 | * | * | * | * | * | * | 0.06500 |
| mai 29 , 2026 | juin 08 , 2026 | * | * | * | * | * | * | 0.06500 |
| avr. 30 , 2026 | mai 08 , 2026 | * | * | * | * | * | * | 0.06500 |
| mars 31 , 2026 | avr. 15 , 2026 | * | * | * | * | * | * | 0.06500 |
| févr. 27 , 2026 | mars 13 , 2026 | * | * | * | * | * | * | 0.06500 |
| janv. 30 , 2026 | févr. 13 , 2026 | * | * | * | * | * | * | 0.06500 |
| déc. 31 , 2025 | janv. 15 , 2026 | 0.00000 | 0.00000 | 0.01638 | (0.00284) | 0.00000 | 0.04396 | 0.05750 |
| nov. 28 , 2025 | déc. 12 , 2025 | 0.00000 | 0.00000 | 0.01638 | (0.00284) | 0.00000 | 0.04396 | 0.05750 |
| oct. 31 , 2025 | nov. 14 , 2025 | 0.00000 | 0.00000 | 0.01638 | (0.00284) | 0.00000 | 0.04396 | 0.05750 |
| Total | 0.00000 | 0.00000 | 0.04914 | (0.00852) | 0.00000 | 0.13188 | 0.77250 | |
Distributions
Les détails des distributions fiscales seront communiqués annuellement aux porteurs de parts en mars. Ces renseignements seront également publiés sur le site Web dès qu'ils seront disponibles.
Ces renseignements sont de nature générale et ne constituent pas un avis juridique ou fiscal personnalisé. Il est donc conseillé aux investisseurs potentiels de consulter leurs propres conseillers fiscaux afin d'obtenir des conseils adaptés à leur situation personnelle.
Répartition des taxes
L’ imposition des distributions s’applique aux détenteurs qui, aux fins de la Loi de l’impôt sur le revenu (Canada), résident au Canada et détiennent des parts de fiducie à titre de biens en immobilisations. Sinon, il est recommandé de consulter un conseiller fiscal.
Les détenteurs de parts de fiducie non détenues dans un REER, un RPDB, un FERR, un REEE ou un CELI devraient recevoir un feuillet T3 de leur courtier en valeurs mobilières. Ce feuillet T3 supplémentaire indiquera les revenus de placement à la case 26, les revenus étrangers non commerciaux à la case 25, les gains en capital à la case 21 et les revenus de dividendes aux cases 23 et 49. Les revenus de dividendes sont assujettis aux règles de majoration standard et au crédit d’impôt fédéral pour dividendes.
La composante de remboursement de capital est un montant non imposable qui sert à réduire le prix de base rajusté des parts du Fonds et est déclarée dans la case 42.
Avis de non-responsabilité
Ressources
Documents du fonds
-
Profil du fonds

-
Profil du fonds
-
Pourquoi investir ?
-
Pourquoi investir - FR
-
Résumé du portefeuille
-
Commentaire
-
Commentaire
-
Introduction aux options d'achat couvertes
-
Ressources KYP

Communiqués de presse
Tableau de distribution
| Date d'enregistrement | Date de paiement | gains en capital | Dividende admissible | Revenus étrangers non commerciaux | Impôt étranger sur le revenu non commercial payé | Autres revenus | Remboursement du capital | Distribution totale |
|---|---|---|---|---|---|---|---|---|
| sept. 30 , 2026 | oct. 08 , 2026 | * | * | * | * | * | * | 0.07000 |
| août 31 , 2026 | sept. 09 , 2026 | * | * | * | * | * | * | 0.07000 |
| juill. 31 , 2026 | août 11 , 2026 | * | * | * | * | * | * | 0.07000 |
| juin 30 , 2026 | juill. 09 , 2026 | * | * | * | * | * | * | 0.06500 |
| mai 29 , 2026 | juin 08 , 2026 | * | * | * | * | * | * | 0.06500 |
| avr. 30 , 2026 | mai 08 , 2026 | * | * | * | * | * | * | 0.06500 |
| mars 31 , 2026 | avr. 15 , 2026 | * | * | * | * | * | * | 0.06500 |
| févr. 27 , 2026 | mars 13 , 2026 | * | * | * | * | * | * | 0.06500 |
| janv. 30 , 2026 | févr. 13 , 2026 | * | * | * | * | * | * | 0.06500 |
| déc. 31 , 2025 | janv. 15 , 2026 | 0.00000 | 0.00000 | 0.01638 | (0.00284) | 0.00000 | 0.04396 | 0.05750 |
| nov. 28 , 2025 | déc. 12 , 2025 | 0.00000 | 0.00000 | 0.01638 | (0.00284) | 0.00000 | 0.04396 | 0.05750 |
| oct. 31 , 2025 | nov. 14 , 2025 | 0.00000 | 0.00000 | 0.01638 | (0.00284) | 0.00000 | 0.04396 | 0.05750 |
| Total | 0.00000 | 0.00000 | 0.04914 | (0.00852) | 0.00000 | 0.13188 | 0.77250 | |
Distributions
Les détails des distributions fiscales seront communiqués annuellement aux porteurs de parts en mars. Ces renseignements seront également publiés sur le site Web dès qu'ils seront disponibles.
Ces renseignements sont de nature générale et ne constituent pas un avis juridique ou fiscal personnalisé. Il est donc conseillé aux investisseurs potentiels de consulter leurs propres conseillers fiscaux afin d'obtenir des conseils adaptés à leur situation personnelle.
Répartition des taxes
L’ imposition des distributions s’applique aux détenteurs qui, aux fins de la Loi de l’impôt sur le revenu (Canada), résident au Canada et détiennent des parts de fiducie à titre de biens en immobilisations. Sinon, il est recommandé de consulter un conseiller fiscal.
Les détenteurs de parts de fiducie non détenues dans un REER, un RPDB, un FERR, un REEE ou un CELI devraient recevoir un feuillet T3 de leur courtier en valeurs mobilières. Ce feuillet T3 supplémentaire indiquera les revenus de placement à la case 26, les revenus étrangers non commerciaux à la case 25, les gains en capital à la case 21 et les revenus de dividendes aux cases 23 et 49. Les revenus de dividendes sont assujettis aux règles de majoration standard et au crédit d’impôt fédéral pour dividendes.
La composante de remboursement de capital est un montant non imposable qui sert à réduire le prix de base rajusté des parts du Fonds et est déclarée dans la case 42.
Communiqués de presse
Données du marché fournies par TMX et optimisées par QuoteMedia
* Le rendement représente une estimation du rendement annuel qu'un investisseur recevrait si la dernière distribution mensuelle restait inchangée pendant les 12 prochains mois, exprimé en pourcentage du cours de clôture de l'action/part du fonds.
Cette page Web est fournie à titre informatif seulement et ne constitue ni une offre de vente ni une sollicitation d'achat des titres mentionnés. Les opinions exprimées dans ce rapport sont celles de Brompton Funds Limited (« BFL ») et peuvent être modifiées sans préavis. BFL met tout en œuvre pour que les informations proviennent de sources jugées fiables et exactes. Toutefois, BFL décline toute responsabilité en cas de pertes ou de dommages, directs ou indirects, résultant de l'utilisation de ces informations. BFL n'est pas tenue de mettre à jour les renseignements contenus dans le présent document. Ces renseignements ne peuvent pas remplacer votre propre jugement. Veuillez lire le prospectus avant d'investir.
Des commissions, des commissions de suivi, des frais de gestion et des dépenses peuvent être associés aux placements dans des fonds négociés en bourse (FNB). Veuillez lire le prospectus avant d'investir. Les taux de rendement indiqués correspondent aux rendements totaux annuels composés historiques, incluant les variations de la valeur des parts et le réinvestissement de toutes les distributions. Ils ne tiennent pas compte des frais de vente, de rachat, de distribution ou des frais optionnels, ni des impôts sur le revenu payables par les porteurs de parts, qui auraient réduit les rendements. Les FNB ne sont pas garantis, leur valeur fluctue fréquemment et le rendement passé ne garantit pas le rendement futur.
Les renseignements sur cette page Web ont été publiés à une date précise. Bien qu'elles soient considérées comme exactes et fiables au moment de leur publication, nous ne pouvons garantir leur exhaustivité ni leur actualité en tout temps. Certaines déclarations figurant sur cette page Web constituent des renseignements prospectifs au sens des lois canadiennes sur les valeurs mobilières. Ces renseignements prospectifs peuvent porter sur des éléments divulgués sur cette page Web et sur d'autres éléments mentionnés dans les documents publics relatifs au FNB, sur les perspectives d'avenir du FNB et sur les événements ou résultats anticipés, et peuvent inclure des déclarations concernant le rendement financier futur du FNB. Dans certains cas, les informations prospectives peuvent être identifiées par des termes comme « peut », « pourrait », « devrait », « s'attend à », « prévoit », « anticipe », « croit », « a l'intention de », « estime », « prédit », « potentiel », « continue » ou d'autres expressions similaires concernant des éléments qui ne constituent pas des faits historiques. Les résultats réels peuvent différer de ces informations prospectives. Les investisseurs ne devraient pas se fier indûment aux déclarations prospectives. Ces déclarations prospectives sont faites à la date des présentes et nous n'assumons aucune obligation de les mettre à jour ou de les réviser pour tenir compte de nouveaux événements ou circonstances.
Prêt à acheter ?
Parlez-en à votre conseiller en placement ou effectuez vos transactions directement par l'entremise de votre courtier.