
Funds in focus: BAAA/BAAA.U | BBBB/BBBB.U
Fixed income underperformance has become a long-term problem. Most fixed income asset class returns have struggled to keep up with the rate of inflation over the past five years, producing negative real returns and diluting inflation-adjusted wealth for investors.
In the early 1980’s, interest rates on US and Canada 5- and 10-year government bonds peaked and then started a long process of decline. Inflation followed a similar path. For many years, interest-sensitive bond portfolios repriced higher as rates ground lower, and fixed income investors benefited.1
Several factors may contribute to this historical pattern. Political uncertainty surrounding potential changes in congressional control, fiscal policy, taxation and regulation can weigh on investor confidence. At the same time, midterm elections often coincide with a period when the administration’s initial policy initiatives are being reassessed, creating additional uncertainty around the economic outlook.
Interest rates and inflation bottomed out in 2020 during the global pandemic and began to rise. In September 2026, the most recent reading, US CPI increased to 3.7% y/y while Canadian CPI climbed to 3.1% y/y.2 Also in September 2026, the Federal Reserve increased the Fed Funds Rate by 0.25% to 4.00%, with the Bank of Canada acting in October to increase the Overnight Rate by 0.25% to 2.50%. Long rates in both countries have shifted higher across the yield curve over the past year, and further short rate hikes may be in the cards.3 Fixed income investors are now experiencing the downside of interest rate sensitivity.
The chart below illustrates this issue, comparing the cumulative total returns of major U.S. and Canadian bond segments against CPI over the past five years.4 The only major fixed-income asset classes that have exceeded inflation (and grown wealth in real terms) have been floating-rate AAA or investment-grade collateralized loan obligations (“CLOs”), along with sub-investment grade senior loans.
S&P 500 average price returns during the presidential cycle since 1945
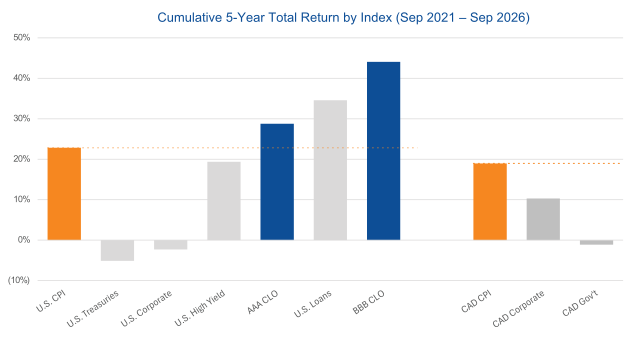
Source: Bloomberg, cumulative total return from September 2021 to September 2026
Floating rate exposure is critical to generating real returns in a fixed income portfolio, but many investors remain grossly under allocated. Investors can gain the benefits of high-quality floating-rate CLO exposure with Brompton Wellington Square AAA CLO ETF (TSX:BAAA, CAD-H or BAAA.U, USD) which holds a minimum of 75% AAA-rated U.S. CLO bonds, and Brompton Wellington Square Investment Grade CLO ETF (TSX:BBBB, CAD-H, or BBBB.U USD) with a minimum of 75% investment grade CLO bonds (BBB-rated or higher).
Distributions Rates & Historical Performance:5, 6
| Distribution Yield | YTD | 1-YR | Since Inception | Inception Date | |
|---|---|---|---|---|---|
| BAAA | 4.8% | 2.7% | 3.1% | 3.4% | April 22, 2025 |
| BAAA.U | 4.7% | 4.1% | 5.0% | 5.0% | April 22, 2025 |
| BBBB | 6.9% | 1.2% | 1.5% | 1.3% | October 3, 2025 |
| BBBB.U | 6.8% | 2.6% | 3.2% | 3.1% | October 3, 2025 |
1 Bloomberg, as of September 2026. U.S. and Canada 5- and 10-year government bond yields; U.S. CPI: CPURNSA Index; Canadian CPI: CACPI Index.
2 Bloomberg, year-over-year change for September 2026, the latest CPI data available. U.S. CPI: CPURNSA Index; Canadian CPI: CACPI Index.
3 Bloomberg, as of September 2026. Federal Funds Target Rate (upper bound), Bank of Canada Overnight Rate, and U.S. and Canada government bond yields.
4 Bloomberg, cumulative total return from September 2021 to September 2026. U.S. CPI: CPURNSA Index; U.S. Treasuries: Bloomberg US Treasury Index; U.S. Corporate: Bloomberg US Corporate Index; U.S. High Yield: Bloomberg US High Yield Index; AAA CLO: J.P. Morgan US AAA CLO Index; U.S. Loans: S&P UBS Leveraged Loan Index; BBB CLO: J.P. Morgan US BBB CLO Index; CAD CPI: CACPI Index; CAD Corporate: Bloomberg Canada Aggregate Corporate Index; CAD Gov’t: Bloomberg Canada Aggregate Treasury Index.
5 Distribution rate is based on October 31, 2026 closing market price. Source: LSEG Workspace.
6 Returns are for the periods ended October 31, 2026 and are unaudited. Inception dates are noted in the table above. The table shows each ETF’s compound returns for each period indicated. Past performance does not necessarily indicate how the ETFs will perform in the future. The information shown is based on net asset value per unit and assumes that cash distributions made by the ETFs during the periods shown were reinvested at net asset value per unit in additional units of the ETFs.
This report is for information purposes only and does not constitute an offer to sell or a solicitation to buy the securities referred to herein. The opinions contained in this report are solely those of Brompton Funds Limited (“BFL”) and/or Wellington Square Advisors Inc., and are subject to change without notice. BFL makes every effort to ensure that the information has been derived from sources believed to be reliable and accurate. However, BFL assumes no responsibility for any losses or damages, whether direct or indirect which arise from the use of this information. BFL is under no obligation to update the information contained herein. The information should not be regarded as a substitute for the exercise of your own judgment. Please read the prospectus before investing.
Commissions, trailing commissions, management fees and expenses all may be associated with exchange-traded fund investments. The indicated rates of return are the historical annual compounded total returns including changes in unit value and reinvestment of all distributions and do not take into account sales, redemption, distribution or optional charges or income taxes payable by any securityholder that would have reduced returns. Please read the prospectus before investing. Exchange-traded funds are not guaranteed, their values change frequently and past performance may not be repeated.
Information contained in this document was published at a specific point in time. Upon publication, it is believed to be accurate and reliable, however, we cannot guarantee that it is complete or current at all times. Certain statements contained in this document constitute forward-looking information within the meaning of Canadian securities laws. Forward-looking information may relate to matters disclosed in this document and to other matters identified in public filings relating to the ETFs, to the future outlook of the ETFs and anticipated events or results and may include statements regarding the future financial performance of the ETFs. In some cases, forward-looking information can be identified by terms such as “may”, “will”, “should”, “expect”, “plan”, “anticipate”, “believe”, “intend”, “estimate”, “predict”, “potential”, “continue” or other similar expressions concerning matters that are not historical facts. Actual results may vary from such forward-looking information. Investors should not place undue reliance on forward-looking statements. These forward-looking statements are made as of the date hereof and we assume no obligation to update or revise them to reflect new events or circumstances.